REPORTING & ANALYSIS
VTA uses techniques such as data visualization to view real-time and historical trends in the number of visitors to stores. It creates printable reports by few clicks presentation type of charts including line charts, bar charts, pie charts, etc. Users can pick a start and end date, select a type of chart and compare with different store's performance with another. It allows to choose the time intervals on number of people per month, per week, per day or per hour. With VTA, managers can monitor performance and evaluate changes and adjust staffing opening hours to match visitor flow.
Measuring the Impact of Advertising & Promotions
- Promote through newspapers, flyers, direct mail, radio, tv, or magazines. By looking at traffic patterns and make a comparison, it will shows how effectiveness advertising accomplishing its objective.
- If advertising is working, should expect to see some impact on store's traffic pattern. When monitor traffic consistently, it ables to see clearly the result of advertising and compare with two promotions.
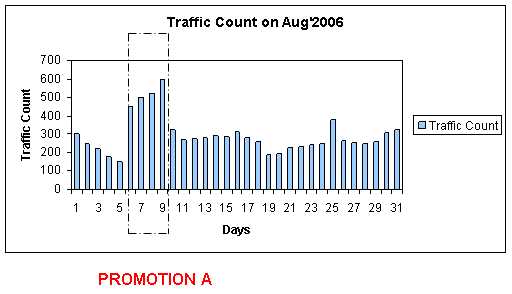
- In promotion A shown in figure above shows that traffic levels have increased compare to the traffic levels prior to and after the promotion period.

- In promotion B shown in figure above shows that traffic levels have not increased during the promotion period. In this case, it appears as though promotion B had little or no impact on traffic.
|